The Prevalence of Social Isolation
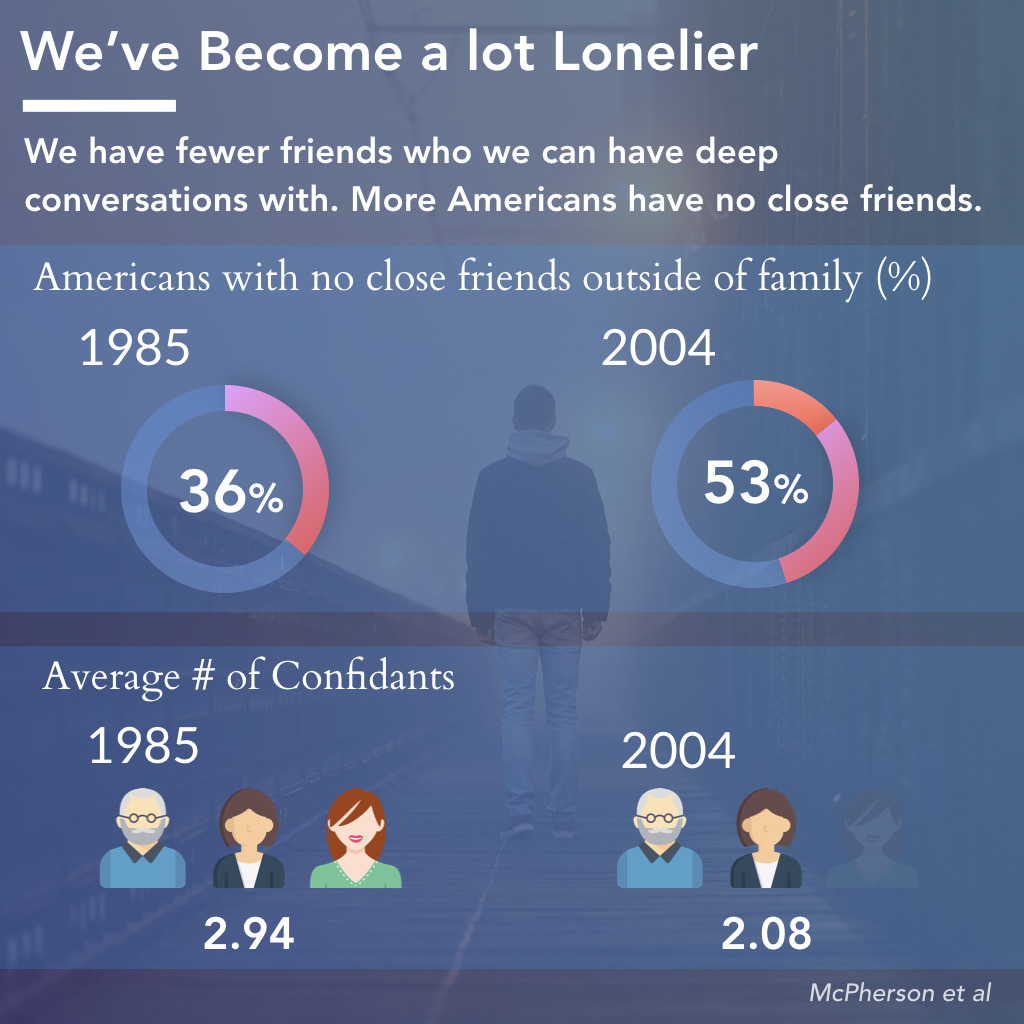
Figure 1: The Prevalence of Social Isolation. We have fewer friends who we can have deep conversations with. More Americans have no close friends. The percent of Americans with no close friends outside of family rise from 36% in 1985 to 53% in 2004. The average number of close confidants has declined from 2.94 in 1985 to 2.08 in 2004.
A study looking at social isolation in 1985 and 2008 shows Americans have become more isolated.
The General Social Survey was a nation-wide survey that looked at the number of close confidants and friends Americans have, among other sociological matters.
Surveyed volunteers in 2004 were much more likely to have no close friends outside of their family. In 1985, 36% of Americans had no close friends outside of their family. In 2004, more than half, 53%, reported no close friends outside of family.
Americans on average have about 1/3rd fewer close friends than they did in the 1980s. The average number of close confidants, as defined by individuals with whom we discuss important issues with, has also declined from 2.94 to 2.08.
+
Sample Size - This study used a large enough sample set to show differences between the two years surveyed..
-
Descriptive Study - This study examined survey results to analyze prevalence. The data could not/was not evaluated for statistical significance.
-
Effect Size - This study was not designed as a statistical study, therefore it's not possible to determine effect sizes.
-
Self Reported Data - Self reported information tends to be prone to bias. This particular study was prone to individuals inflating the number of close friends that they have.
-
Study Age - While older studies can be valid for effects that don't change over time, such as physics or anatomy, this particular study is less effective given its age and subject matter.
This scooter study was a descriptive study. These are great ways of quickly collecting and describing data. However, they cannot be used to determine relationships between variables or causal relationships. Common examples of descriptive studies include surveys and market research.
Limitations of Self Reported Data
Much of the data in this social isolation study is self-reported, which has several limitations and sources of bias. Self-reported data, which is obtained through surveys and questionaires, is the most feasible way of collecting data from large subsets of the population. However, the data may suffer from recall bias, where respondents may forget certain details or may not accurately remember details. They may also suffer from social desirability bias, where respondents may be reluctant to admit to socially undesirable behaviors, even if the survey is anonymous.
Source: Social Isolation in America: Changes in Core Discussion Networks over Two Decades
Social Network Diversity: Race & Education
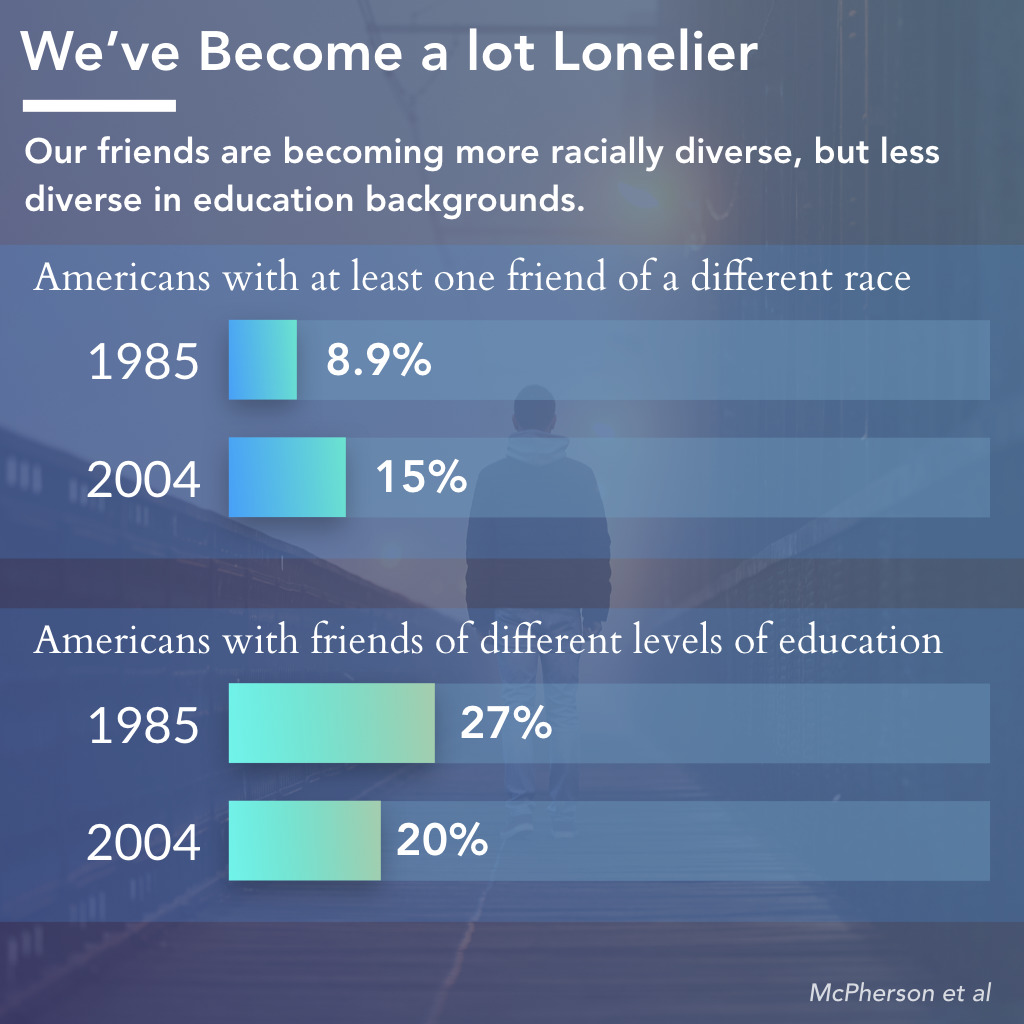
Figure 2: Social Network Diversity: Race & Education. Our friends have become more diverse in terms of race but less so in terms of levels of education. 15% of Americans reported at least one friend of a different race in 2004, compared to 8.9% in 1985. 27% of Americans reported having multiple friends with different education backgrounds in 1985, but only 20% did in 2004.
Our friend group composition has also changed over time. We've become more likely to have at least one friend of a different race than ourselves. Only 8.9% of Americans had a close friend of a different race 1985 compared to 15% in 2004.
However, we're less likely to have diversity in education backgrounds within our friend groups. In 1985, 27% of Americans had multiple close friends with different education backgrounds compared to only 20% in 2004.
Source: Social Isolation in America: Changes in Core Discussion Networks over Two Decades
Social Isolation vs Education
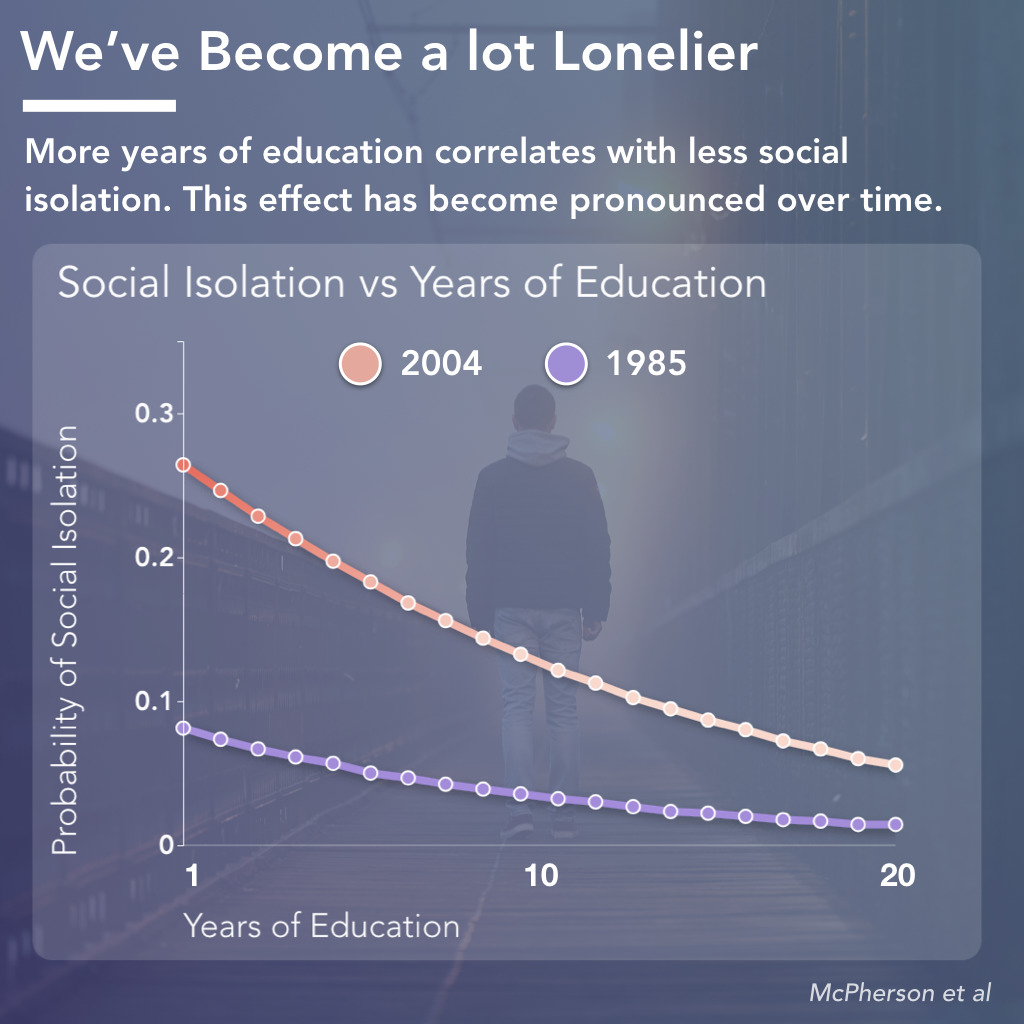
Figure 3: Social Isolation vs Education. Social isolation odds correlate with years of education. Americans are more likely to be socially isolated in 2004 than in 1985. Americans with less education are much more affected by this trend.
Education attainment has become far more important in our odds of social isolation as well. The more educated you are, the less likely you are to be socially isolated.
Americans across all levels of education had lower odds of social isolation in the 1980s.
In the 2000s, social isolation rose for all. However, it rose a lot more for those with less education according to a statistical model generated from the survey data.
This study on social isolation used a statistical model to analyze and present the data. In this process, researchers take the raw data generated in the study and try to find an equation or a "line" that best fits and captures the relationship between the variables. The benefits are that it allows you to easily see the trends within the data. The downside is that the model is not a perfect fit of the raw data. Also, there may be multiple possible models that fit the data well, which may not be presented.
Key Takeaways
This study, while on the older side, highlights a potentially concerning trend. If you feel that people today have fewer friends than before, these data suggest that you're not wrong and not alone in that feeling.
Keep in mind that none of this is set in stone. We all have a choice to go out, take some risks, and make new friends.
This also suggests a great opportunity for making an impact. If you see someone who looks lonely and who may need a friend, you might be right. If you feel comfortable with it, a quick complement or chat may be enough to really brighten someone's day.