Children: Time Watching TV vs On the Computer
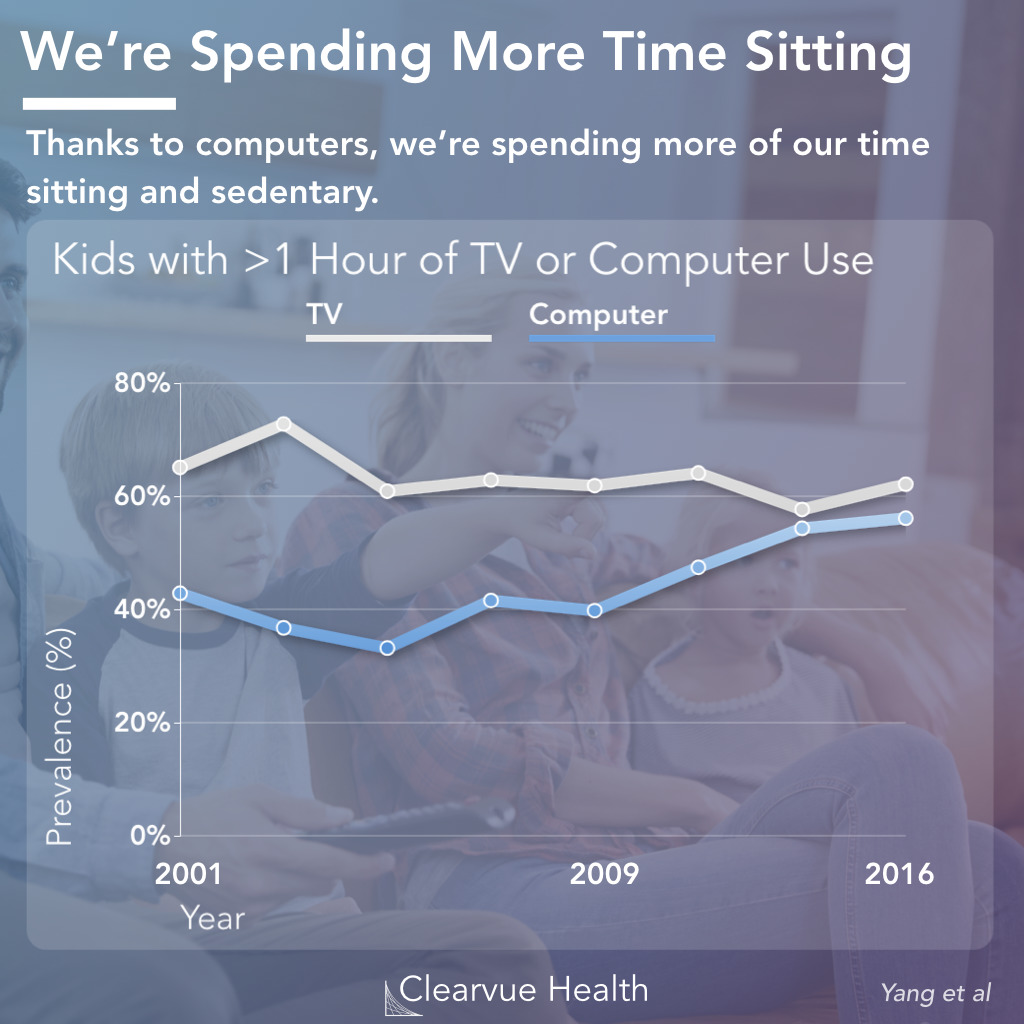
Figure 1: Children - Time Watching TV vs On the Computer. Around 60% of kids watch at least an hour of TV per day. This has remained stable since 2001. However, the proportion of kids using the computer for at least 1 hour a day has increased from 40% to nearly 60%. Data was obtained from the National Health and Nutrition Examination Survey (NHANES) from American children and adults aged 5 and older.
New research shows that we're using the computer more today, while watching just as much TV. All in all, this suggests that we're becoming more sedentary as a society thanks to computers and television.
In a recent analysis of data from 51,896 Americans, as part of the NHANES study, researchers estimated trends in sedentary behavior across age and across time.
They found that around 60% of American kids watched at least 1 hour of TV a day, which has remained roughly stable since 2001.
However, during that same period, the percentage of kids using the computer at least 1 hour per day has surged from 40% to nearly 60%.
Limitations of Self Reported Data
This study uses self-reported data, which has several limitations and sources of bias. Self-reported data, which is obtained through surveys and questionaires, is the most feasible way of collecting data from large subsets of the population. However, the data may suffer from recall bias, where respondents may forgot certain details or may not accurately remember details from further back. They may also suffer from social desirability bias, where respondents may be reluctant to admit to socially undesirable behaviors, even if the survey is anonymous.
Source: Trends in Sedentary Behavior Among the US Population, 2001-2016
Adults: Time Watching TV vs On the Computer
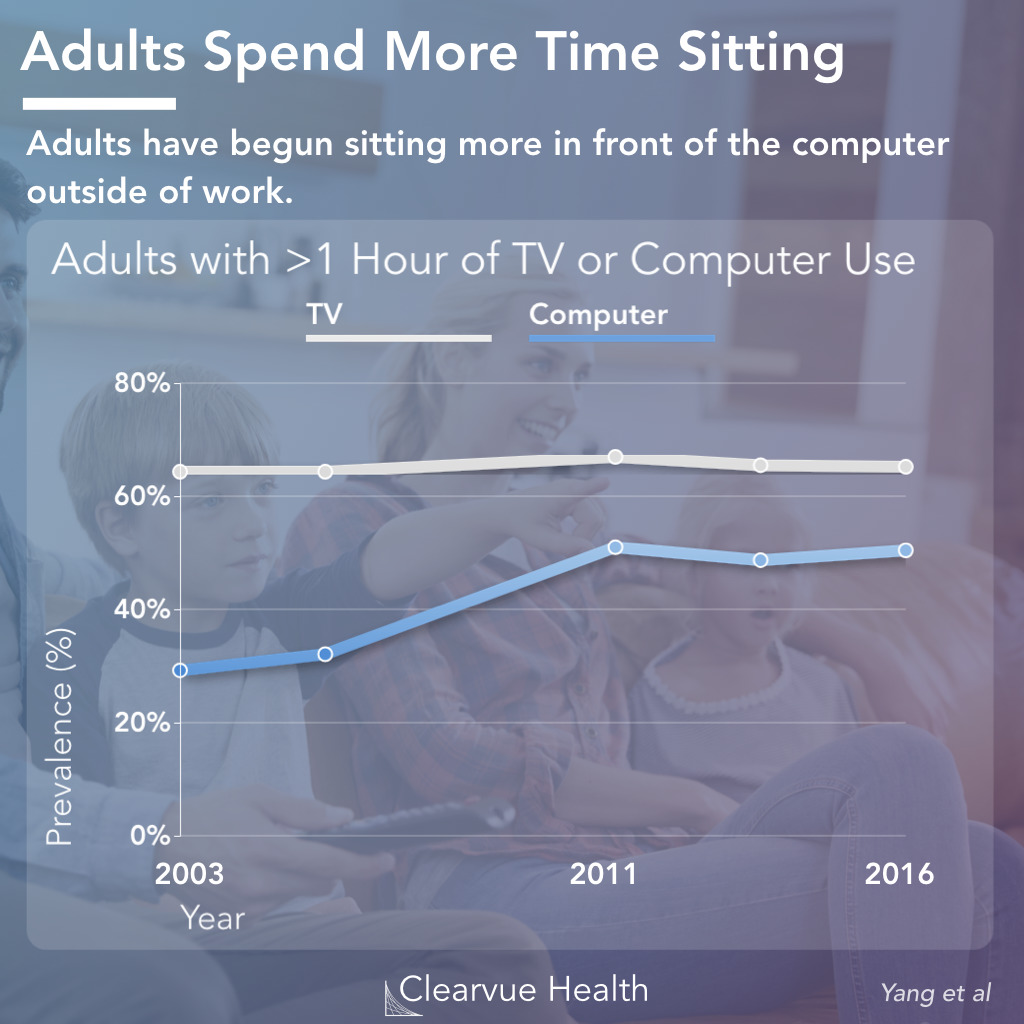
Figure 2: Adults - Time Watching TV vs On the Computer. Over 60% of adults watch at least an hour of TV per day. This has remained stable since 2001. However, the proportion of adults using the computer for at least 1 hour a day has increased from 30% to around 50%. Data was obtained from the National Health and Nutrition Examination Survey (NHANES) from American children and adults aged 5 and older.
American adults have similarly have begun spending more time on the computer outside of work. Over 60% of adults continue to spend more than 1 hour a day watching TV.
Meanwhile, just about half of adults now spend at least 1 hour a day on the computer outside of work.
This time may be spent gaming, social media, or just browsing the web. Work-related computer use was not included in this figures.
Source: Trends in Sedentary Behavior Among the US Population, 2001-2016
Kids: In Depth Trends on Time Spent on the Computer
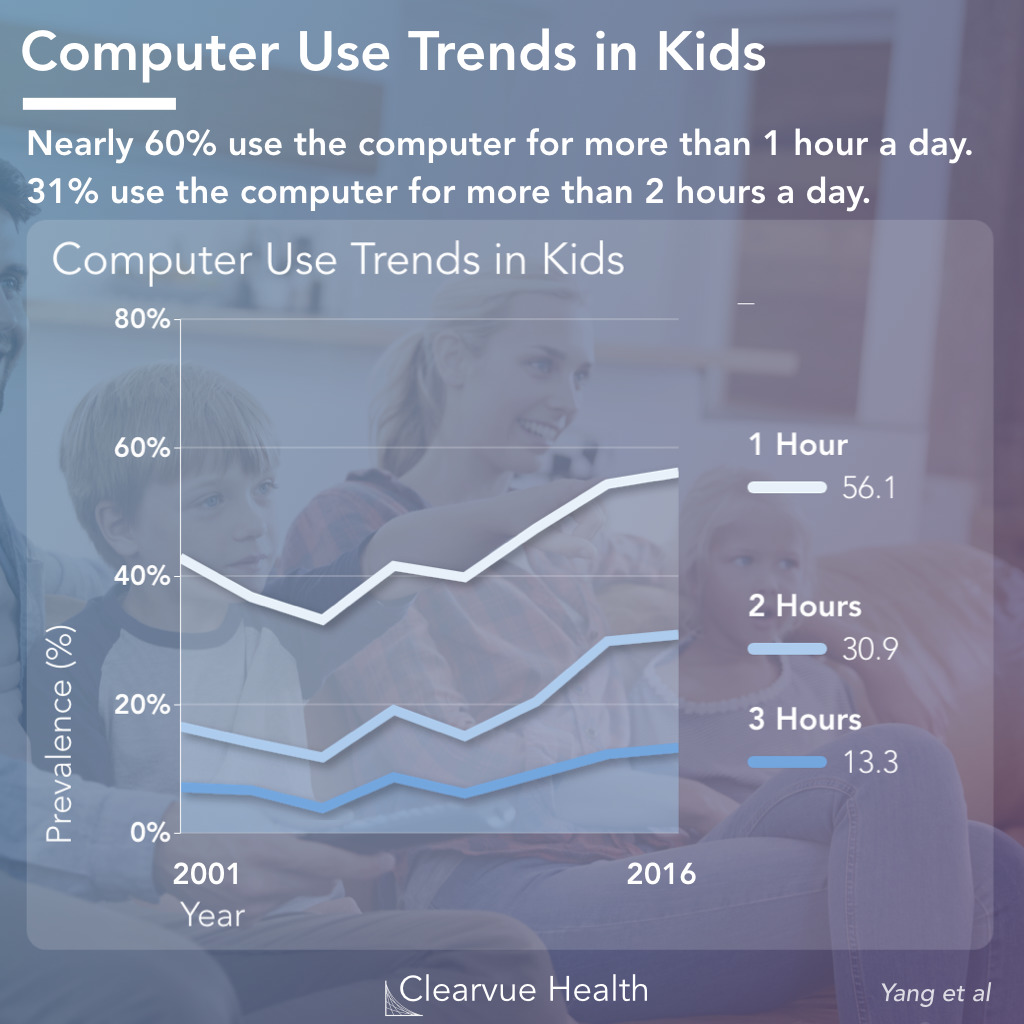
Figure 3: Kids - In Depth Trends on Time Spent on the Computer. Over 50% of kids spend more than 1 hour on the computer. This includes 31% that spent at least 2 hours a day, and 13% that spend at least 3 hours a day on the computer. Data was obtained from the National Health and Nutrition Examination Survey (NHANES) from American children and adults aged 5 and older.
In depth figures show that the numbers of kids who use the computer for 2 or more hours has jumped as well.
The percent of kids who use the computer for at least 2 hours a day outside of school has increased 50% from just under 20% to over 30%.
Similarly, kids who use the computer for at least 3 hours a day has increased from under 10% to over 13%.
Source: Trends in Sedentary Behavior Among the US Population, 2001-2016
Adults: In Depth Trends on Time Spent on the Computer
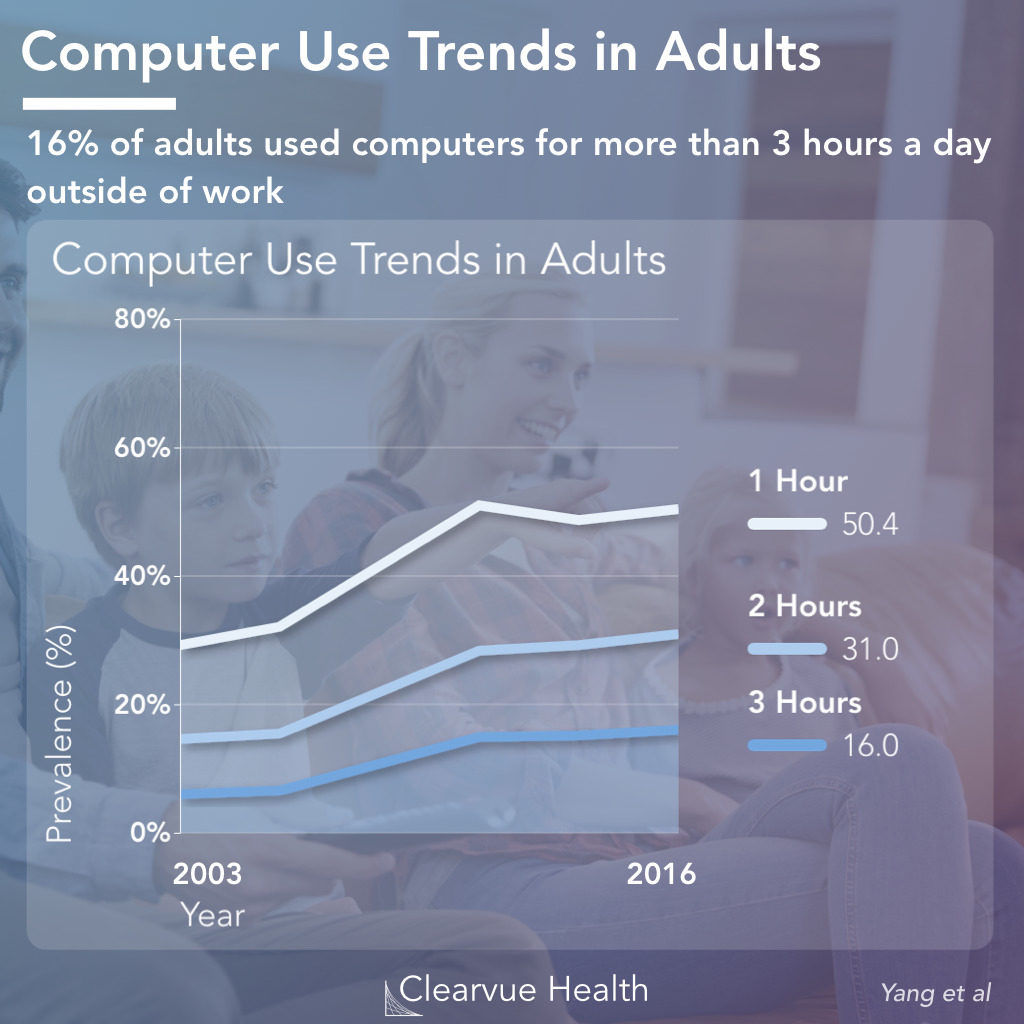
Figure 4: Adults - In Depth Trends on Time Spent on the Computer. 50% of adults spent at least 1 hour a day on the computer outside of work. 31% of adults spent at least 2 hours a day. 16% of adults spent at least 3 hours a day. Data was obtained from the National Health and Nutrition Examination Survey (NHANES) from American children and adults aged 5 and older.
For adults in depth figures show a similar pattern. Nearly 16% of adults spend more than 3 hours a day on the computer outside of work and 31% spend at least 2 hours a day.
This shows that extensive computer use is becoming nearly normal in our society, while we continue to watch just as much TV.
Source: Trends in Sedentary Behavior Among the US Population, 2001-2016
Key Takeaways: The Downsides of Sitting
The primary concern of doctors when it comes to TV and Computer use is the extensive sitting and the lack of physical activity. Sitting in front of the TV or the computer represents a lost opportunity for physical activity and physical health.
“
Prospective evidence is accumulating that sedentary behavior could be a risk factor for CVD and diabetes mellitus morbidity and mortality and for all-cause mortality. The degree to which this is independent of the effects of MVPA needs further study.
Source: Sedentary Behavior and Cardiovascular Morbidity and Mortality: A Science Advisory From the American Heart Association
Related: Workouts Over 40
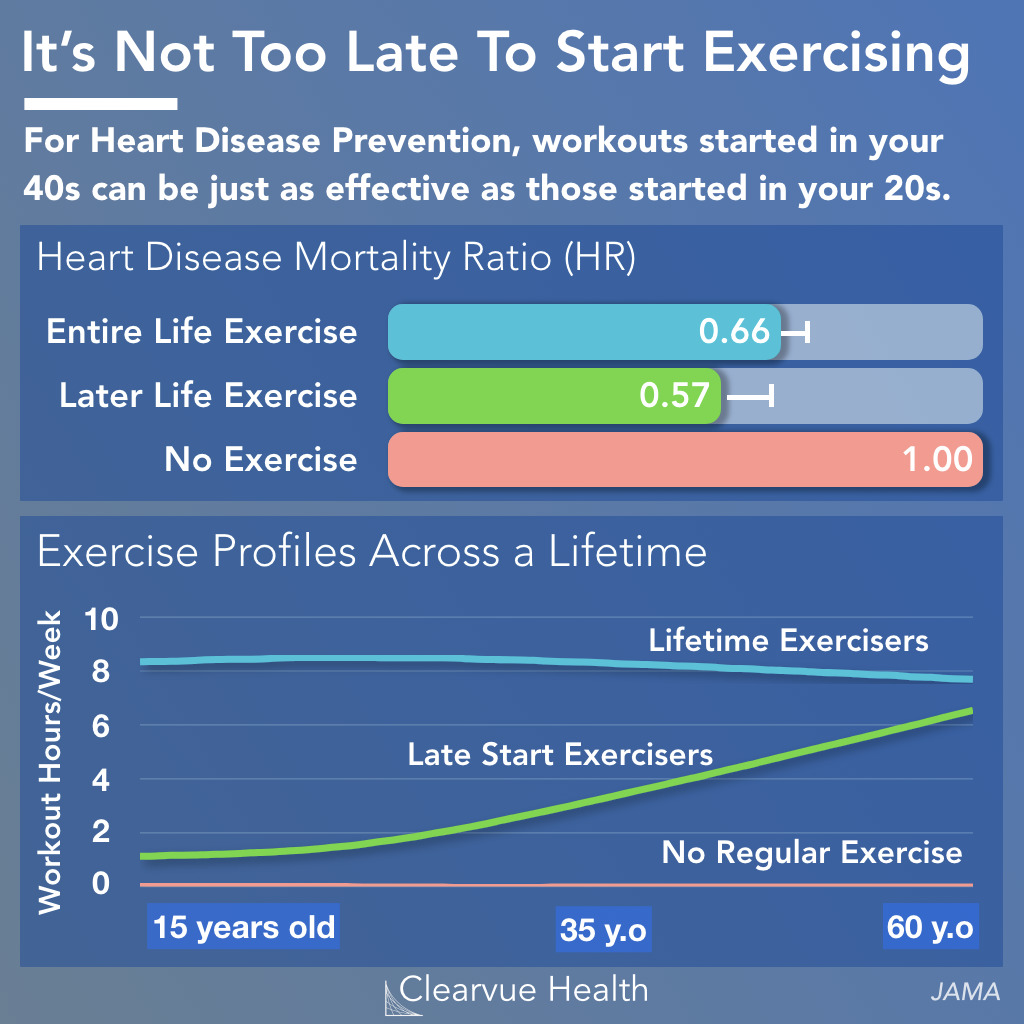
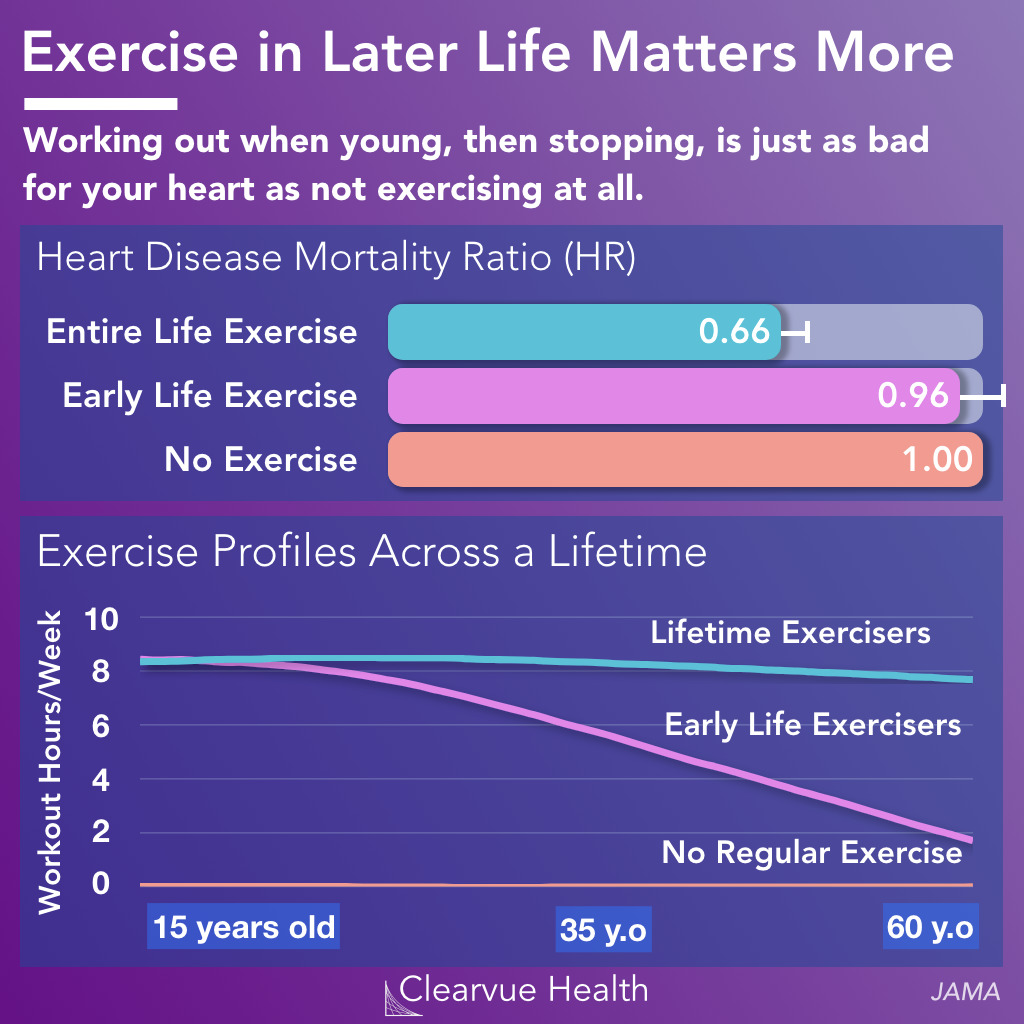
If you want to reverse the negative effects of sitting or using the computer, try starting a workout routine!
New research shows that it is never too late to start exercising. In fact, exercising later in life might just be better for you. The benefits of exercise are very clear. Exercise reduces heart disease and leads to a longer life.
Related: Physical Activity & Commuting
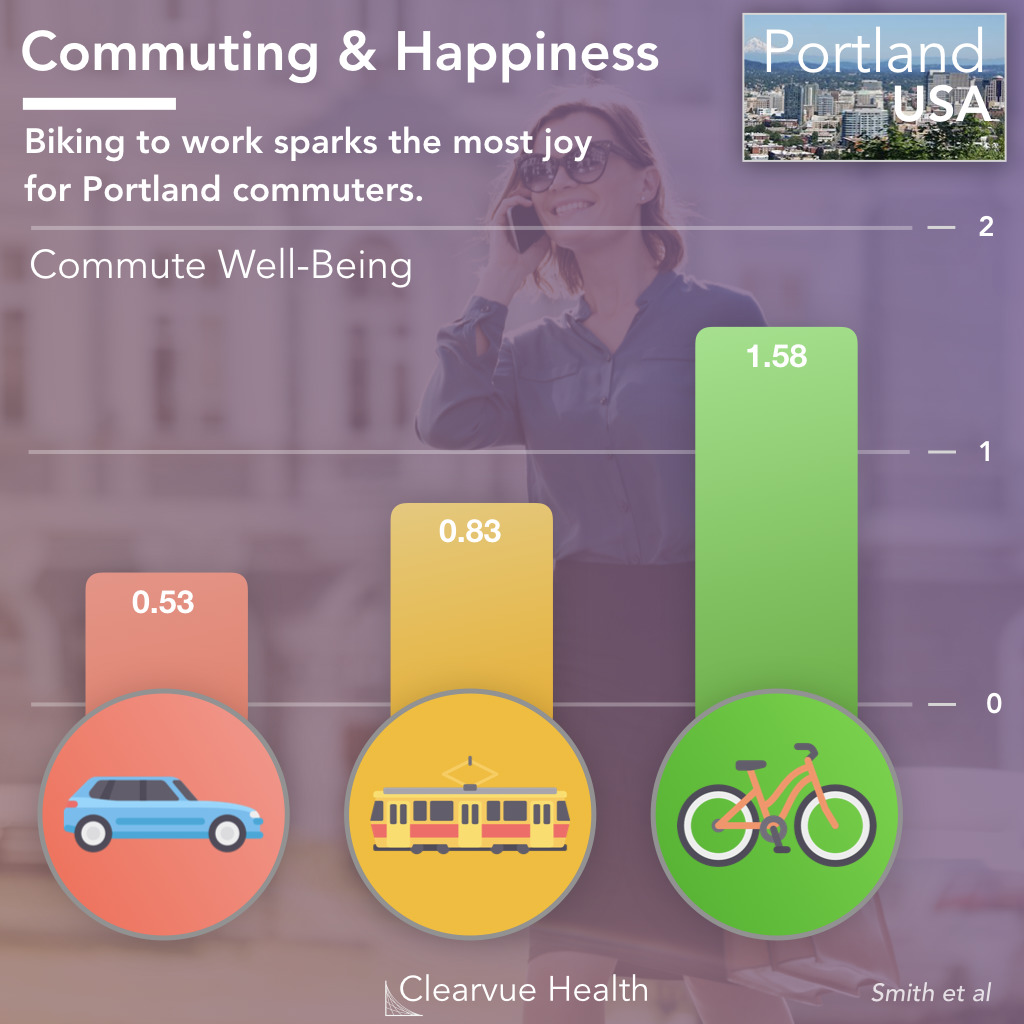
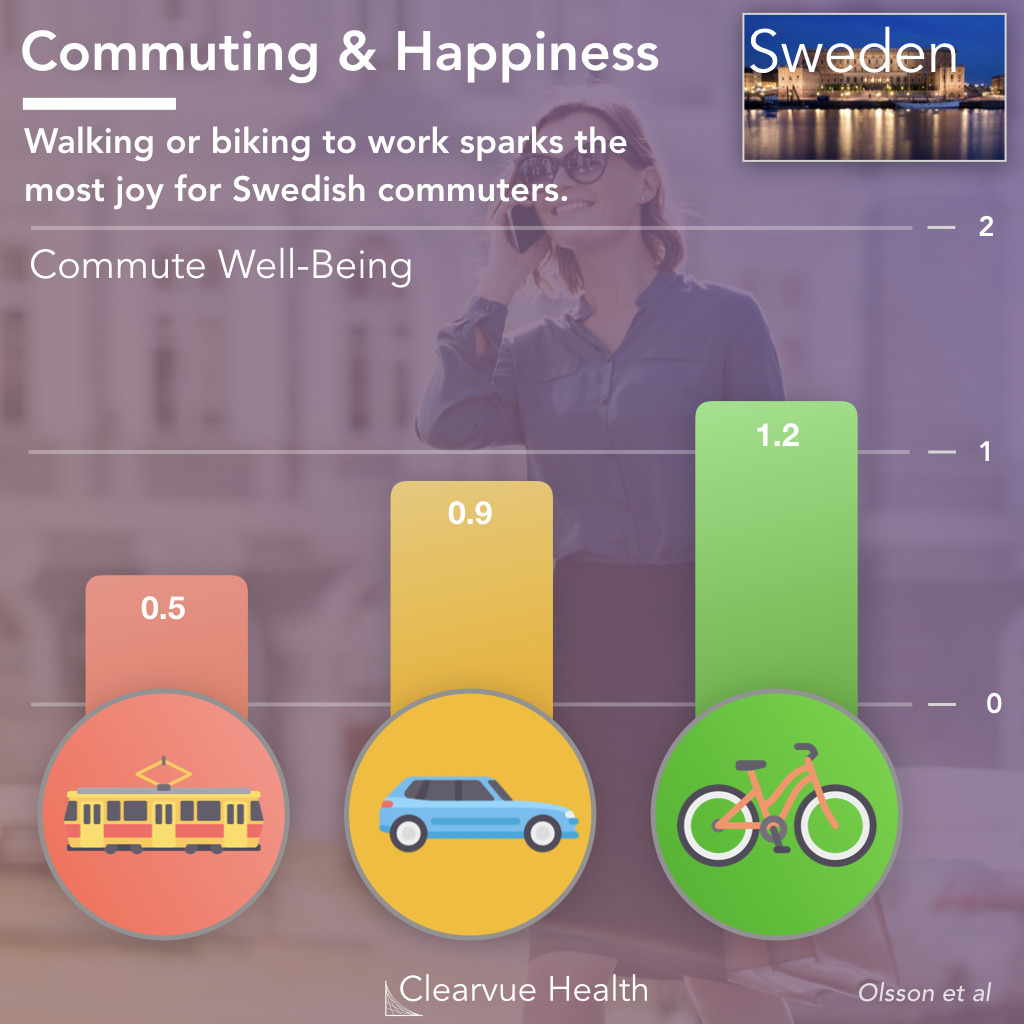
Even if you spend loads of the time on the computer, you can still improve your physical and mental well-being with an active commute, either walking or biking.
Did you know that how you commute is linked to happiness? Studies across two countries have come to similar findings: people who bike or walk to work are happier.